Diagnose Frame Skips And Stutter In DirectX Applications
User experience of games and multi media applications is highly bound to a feeling of smoothness. This smoothness feeling is quickly lost when
- the application does not respond fast enough to input,
- animations stutter or
- audio output is distorted.
Developers have to try hard so none of those three appears. But when they appear, how to find out what’s responsible for it? In this article I’ll show a way to diagnose frame skips.
(Although I’ll be writing specifically about applications using DirectX for rendering, the general concepts can also be applied to applications using OpenGL.)
Tools
Your Swiss Army knife for diagnosing performance problems on Windows 7 and newer is the Performance Toolkit which is part of the Windows SDK. In this article I’ll use Windows Performance Recorder (WPR, wprui), Windows Performance Analyzer (WPA) and GPUView.
The second step will be to record a event trace using WPR. But for a clean and nice event trace – with as little back ground noise as possible –, the first step is to get a clean Windows instance. This means to reboot the computer and end all processes which are not vital for the operation of the OS. Start WPR (wprui, not the command line tool), select ‘First level triage’, ‘CPU usage’, ‘GPU activity’, ‘Desktop composition activity’, ‘Audio glitches’, ‘Video glitches’ from the profiles. Select detail level ‘Verbose’ and log to memory. Start your application. Start the event recording. Wait a little bit and let WPR record the ‘normal’ state of your application. Then make a frame skip or wait until it appears on its own. Depends of the nature of your frame skip problem. If you realize that the frame skip does not appear any more… well, the processes you killed may be a hint. (Repeat the steps adding one process after another until the frame skipping appears again.) Save the recorded trace.
Different Types of Problems
There are many reasons why your application may experience a frame skip:
- Application CPU load
- Your application is heavily CPU dependent. The CPU is not able to process the work required between two vsyncs (16ms for 60Hz).
- Application GPU load
- Your application creates a lot of GPU load (usually shaders processing) so the GPU is not able to process the work between two vsyncs.
- Foreign CPU load
- Background processes occupy a big chunk of CPU time leaving your application insufficient CPU time.
- Foreign GPU load
- Similar as previous but this time GPU related.
- Failing to process CPU and GPU work concurrently
- GPU and CPU are able to work concurrently. If your application waits for the vsync, after finishing the last frame, CPU time is wasted, which is available during GPU processing.
- Bad vsync synchronization
- This is similar to the previous one. If you’re synchronizing to vsync in a bad way (and there are a lot ways to get it wrong) your application wakes up too late after the last vsync, leaving not enough time until the next vsync to process the work required to construct the next frame.
- Locks
- Either locks in your application, or system wide locks, may block your application and make it skip a frame or two.
- System / driver bugs
- This is the nastiest way to loose frames. It’s possible for the OS or graphics driver to have bugs which are triggered by your application and which lead to frame losses.
I won’t discuss driver bugs in this post because there’s usually nothing you can do about it. Most of the time the reason for your frame loss will fall into one of the other categories.
All these types of problems can be made visible using GPUView or the more versatile WPA (Windows Performance Analyzer). Load your recorded trace in GPUView. Matt’s Webcorner has a very nice introduction to GPUView. Read it before you continue here.
Application CPU Load
If the CPU sits all the time in your application’s thread lanes and the ‘present’ GPU package comes too late for the vsync, you’re affected by this kind of problem. See section ‘Large CPU Delay - Dalaran’ in Matt’s introduction to GPUView for screenshots how this looks like in GPUView.
Once you confirmed you’re suffering from this problem, you can switch to WPA and have a look into the ‘CPU Usage (Sampled)’ view to get a hint where your application spends the most time. Every other profiler will aid you on finding bottlenecks in your code too.
Application GPU Load
See section ‘Large Render Time - Mothership Cloaking’ in Matt’s GPUView introduction for screenshots how this looks like. Diagnose this deeper is harder than CPU load. The GPU profiler industry sector is not so mature as the one for CPU profilers. Still, there are couple of tools which are available. And of course there’s always ‘ninja debugging’.
- NVIDIA PerfKit – If you’re the owner of a graphics card with a NVIDIA GPU, those tools might help you to get down to the core of the problem.
- AMD GPU PerfStudio 2
- AMD GPU ShaderAnalyzer
- Intel Graphics Performance Analyzers
- gDEBugger – for OpenGL applications
- RenderDoc – Graphics debugger for D3D11 and OpenGL.
- Ninja debugging – Cut away everything. Add the parts back again, one after another, and measure the performance between the steps. When you identified a part responsible for a big chunk of GPU work, cut it further down and repeat.
Foreign CPU Load
If you see the CPU sitting in the lanes of other processes than yours, you know you have to get rid of them.
Foreign GPU Load
Not so common, but possible. If the graphics card queue is full but not with packets of your process, check which process issued them.
Failing to process CPU and GPU work concurrently
If your application has a lot of CPU work to do, you’d better use every bit of CPU time available. If you rely on the ‘present’ command to block and to wake up your process once the vsync occurred, you’re not using important milliseconds of CPU. I’ll cover the topic on how to synchronize to vsync without relying on blocking ‘present’ command in a later article.
Bad vsync synchronization
If you try to not rely on blocking ‘present’ command and do it wrong, it won’t be any better than relying on ‘present’. I’ll cover this in the same future article as the previous topic.
Locks
It’s possible you’re your own enemy, if you try to do network or file system operations in the same thread you do the graphics stuff. But it’s also possible that you avoided those obviously blocking APIs but your application still was blocked by the system. If you see that your graphics thread wakes up too late after vsync to do its job, you need to analyze what it was waiting on. The second part of this article will explain such a situation in detail.
Blocked by the System
Let’s have a look at a simple application which does some basic DirectX operations. There is not much CPU load. There is little GPU load. Usually the applications runs at constant 60 fps. But from time to time it skips a frame. I recorded a event trace and loaded it in GPUView. First I have to find the position in the trace where the frame skip occurs. There’s a nice shortcut for this. Locate the row with your application’s process and enable the ‘Present Chart’ (Charts > Toggle Present Chart). Have a look in the Latency lane and watch out for spikes:
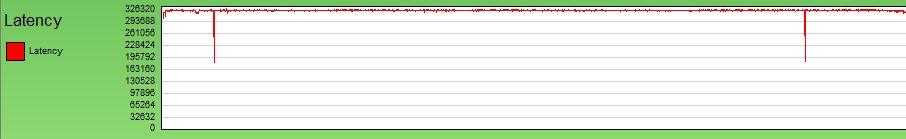
I select the spike and press CTRL-Z to zoom into selection. Now I enable vsync events (F8) and disable the ‘Present Chart’ again. The result looks like this:
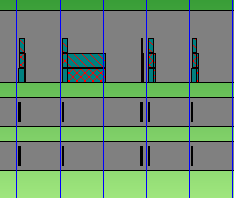
You see three horizontal lanes. The first is the graphic queue of the process. The next two are the two threads running in the application. There are five frames in the screenshot, the blue lines being the vsync events. Three frames look healthy. Little work in the threads, a couple of graphic command packages quickly processed. But in one of the frames the present package (cross-hatched) is kept unusually long in the process queue. Usually the command packets are moved from the process queue to the graphic card queue by the system video scheduler when there’s room in the hardware queue. Here’s a screenshot of the same time period (I increased the zoom a little bit) including the graphics queue.
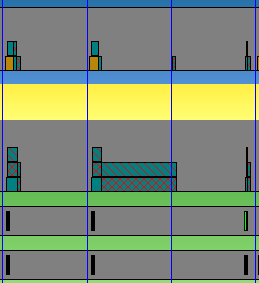
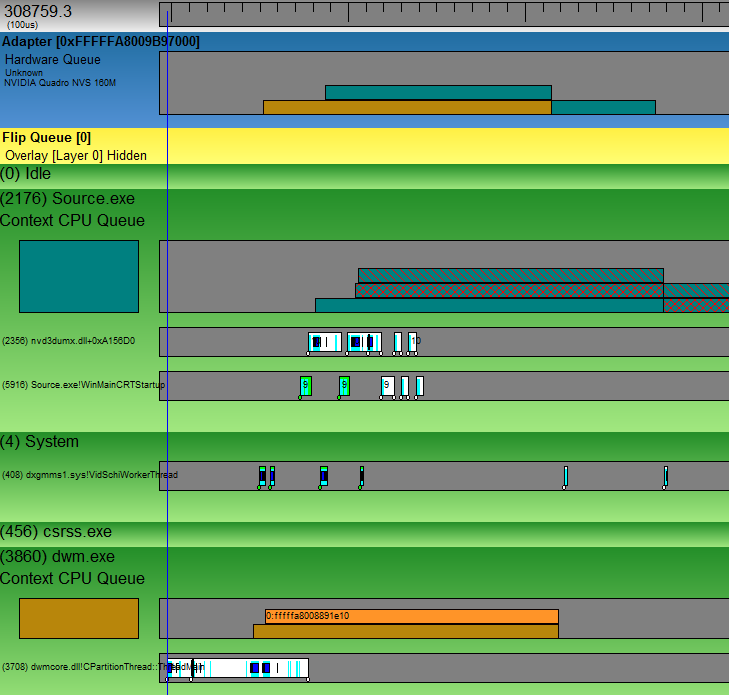
In the first frame on this screenshot the present packet is moved nearly instantly into to the hardware queue and is processed quickly. But in the next frame it remains in the process queue for some reason and is moved and processed not until the third frame. The video scheduler thread is hosted by the System process. Here’s a ‘healthy’ frame zoomed in to show about 3ms after the vsync event.
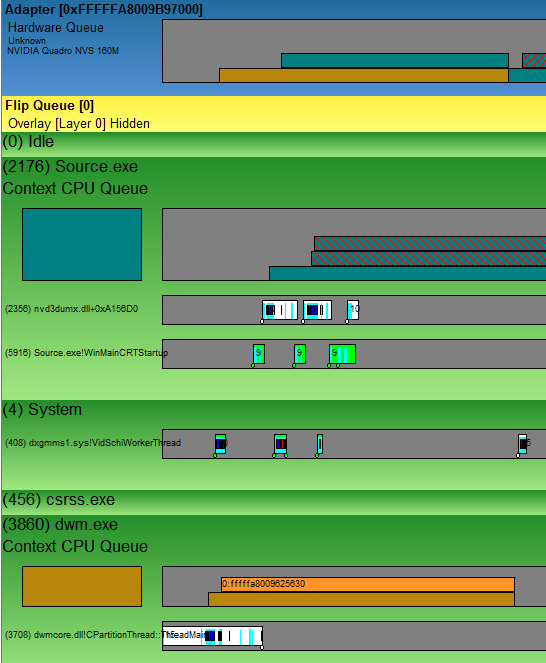
You see the hardware lane (blue), the test application Source.exe, the System process and the Desktop Window Manager (dwm.exe) process. The name of the visible thread in the System lane is already a hint to what it does: ‘VidSchiWorkerThread’. If you look accurately you see how this thread moves the graphic command packets. Shortly after dwm.exe added a packet to its queue (light-brown), the video scheduler wakes up and moves the packet to the hardware lane (Light-brown in the blue lane.) The packet remains in the process lane (green) until its completely processed by the hardware. The video scheduler goes to sleep again and wakes up when Source.exe added a command packet to its queue (blue-greenish). It’s moved to the hardware queue nearly immideately. Then again, it wakes up when the ‘present’ packet (cross-hatched) was added to the process queue. But the hardware queue (blue) currently contains already two packets so the scheduler goes to sleep again and wakes up as the GPU finished the dwm.exe packet. The ‘present’ packet is moved to the GPU queue.
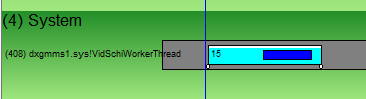
GPUView is able to display the stack of the thread at the time when it was woken up. If the zoom rate is high enough small handles appear at the bottom of the squares denoting the CPU time slices used by the threads. Clicking the handle of the first CPU slice of the System thread, a window will appear displaying a lot of information and a stack trace at the bottom of the window1.
The stack trace of the video scheduler waking up for the first time is (zero is the youngest stack frame, the invocation order is from bottom to top):
0 0xFFFFF80003686F97 ntoskrnl.exe!SwapContext_PatchXRstor+0x103
1 0xFFFFF80003686A8A ntoskrnl.exe!KiSwapContext+0x7A
2 0xFFFFF800036795F2 ntoskrnl.exe!KiCommitThreadWait+0x1D2
3 0xFFFFF800036860EA ntoskrnl.exe!KeWaitForMultipleObjects+0x26A
4 0xFFFFF880043CA3F8 dxgmms1.sys!VidSchiWaitForSchedulerEvents+0x1BC
5 0xFFFFF8800439D2D2 dxgmms1.sys!VidSchiScheduleCommandToRun+0x1DA
6 0xFFFFF880043C9FF6 dxgmms1.sys!VidSchiWorkerThread+0xBA
7 0xFFFFF800039202EA ntoskrnl.exe!PspSystemThreadStartup+0x5A
8 0xFFFFF800036748E6 ntoskrnl.exe!KiStartSystemThread+0x16
Everything above KeWaitForMultipleObjects can be ignored. Just below this call we see what the thread was waiting for: VidSchiWaitForSchedulerEvents. And it was invoked by VidSchiScheduleCommandToRun. I checked the stack traces of the three successive wake ups. Two times it was the same stack trace. But the last time the thread was waiting for something different:
0 0xFFFFF80003686F97 ntoskrnl.exe!SwapContext_PatchXRstor+0x103
1 0xFFFFF80003686A8A ntoskrnl.exe!KiSwapContext+0x7A
2 0xFFFFF800036795F2 ntoskrnl.exe!KiCommitThreadWait+0x1D2
3 0xFFFFF800036860EA ntoskrnl.exe!KeWaitForMultipleObjects+0x26A
4 0xFFFFF880043A10B5 dxgmms1.sys!VidSchWaitForEvents+0xF5
5 0xFFFFF880043CFE79 dxgmms1.sys!VidSchWaitForCompletionEvent+0x139
6 0xFFFFF8800439D2AA dxgmms1.sys!VidSchiScheduleCommandToRun+0x1B2
7 0xFFFFF880043C9FF6 dxgmms1.sys!VidSchiWorkerThread+0xBA
8 0xFFFFF800039202EA ntoskrnl.exe!PspSystemThreadStartup+0x5A
9 0xFFFFF800036748E6 ntoskrnl.exe!KiStartSystemThread+0x16
This time it was waiting for completion (VidSchWaitForCompletionEvent). As already said the thread waits for graphic command packets to appear in process queues and moves them to the GPU queue. When the GPU queue is full, it waits until there’s room.
Next I want to see how the bad frame looks like:
The VidSchiWorkerThread was woken up six times in this frame. It woke up for the first time when dwm.exe added a packet to its queue. It also started adjustment of its own priority for some reason (VidSchiAdjustWorkerThreadPriority). When it was woken up for the second time, it finished the priority adjustment and went to sleep again. The third time it was woken up when Source.exe added a packet to its queue. It finished its work and went to sleep again. The fourth time it was woken up by the new ‘present’ packet. But the GPU queue was full so it went to sleep again, this time waiting for completion of the packet being processed by the GPU. Just like in the ‘good’ frame. But when it woke up for the fifth time, it did not move the present packet to the GPU queue. Even though there was room for a new packet it went to sleep again waiting for something. The stack trace of the sixth packet shows what it was waiting for:
0 0xFFFFF80003686F97 ntoskrnl.exe!SwapContext_PatchXRstor+0x103
1 0xFFFFF80003686A8A ntoskrnl.exe!KiSwapContext+0x7A
2 0xFFFFF800036795F2 ntoskrnl.exe!KiCommitThreadWait+0x1D2
3 0xFFFFF800036860EA ntoskrnl.exe!KeWaitForMultipleObjects+0x26A
4 0xFFFFF880043A10B5 dxgmms1.sys!VidSchWaitForEvents+0xF5
5 0xFFFFF880043CFE79 dxgmms1.sys!VidSchWaitForCompletionEvent+0x139
6 0xFFFFF880043CB82B dxgmms1.sys!VidSchiWaitForEmptyHwQueue+0x8F
7 0xFFFFF880043CA19F dxgmms1.sys!VidSchiHandleControlEvent+0x3B
8 0xFFFFF880043CA47A dxgmms1.sys!VidSchiWaitForSchedulerEvents+0x23E
9 0xFFFFF8800439D2D2 dxgmms1.sys!VidSchiScheduleCommandToRun+0x1DA
10 0xFFFFF880043C9FF6 dxgmms1.sys!VidSchiWorkerThread+0xBA
11 0xFFFFF800039202EA ntoskrnl.exe!PspSystemThreadStartup+0x5A
12 0xFFFFF800036748E6 ntoskrnl.exe!KiStartSystemThread+0x16
It’s waiting for an empty GPU queue (VidSchiWaitForEmptyHwQueue). And VidSchiHandleControlEvent was the reason it started to wait for a empty GPU queue. So there arrived some kind of a control command which made the scheduler clear the GPU queue. But that’s not the end. The ‘present’ packet remained in the software queue until the end of the frame. Just after the next vsync the scheduler thread wakes up:
In the stack trace I can see what it was waiting for:
0 0xFFFFF80003686F97 ntoskrnl.exe!SwapContext_PatchXRstor+0x103
1 0xFFFFF80003686A8A ntoskrnl.exe!KiSwapContext+0x7A
2 0xFFFFF800036795F2 ntoskrnl.exe!KiCommitThreadWait+0x1D2
3 0xFFFFF800036860EA ntoskrnl.exe!KeWaitForMultipleObjects+0x26A
4 0xFFFFF880043A10B5 dxgmms1.sys!VidSchWaitForEvents+0xF5
5 0xFFFFF880043CFE79 dxgmms1.sys!VidSchWaitForCompletionEvent+0x139
6 0xFFFFF880043CB91A dxgmms1.sys!VidSchiWaitForDrainFlipQueue+0x92
7 0xFFFFF880043CA1B0 dxgmms1.sys!VidSchiHandleControlEvent+0x4C
8 0xFFFFF880043CA47A dxgmms1.sys!VidSchiWaitForSchedulerEvents+0x23E
9 0xFFFFF8800439D2D2 dxgmms1.sys!VidSchiScheduleCommandToRun+0x1DA
10 0xFFFFF880043C9FF6 dxgmms1.sys!VidSchiWorkerThread+0xBA
11 0xFFFFF800039202EA ntoskrnl.exe!PspSystemThreadStartup+0x5A
12 0xFFFFF800036748E6 ntoskrnl.exe!KiStartSystemThread+0x16
The control command required even the flip queue to run completely dry. It looks like it was some kind of ‘flush GPU’ command. But what did request this flush? In the screenshots above there was a collapsed process (csrss.exe) which I made visible for the next screenshot. It’s the beginning of the bad frame again:
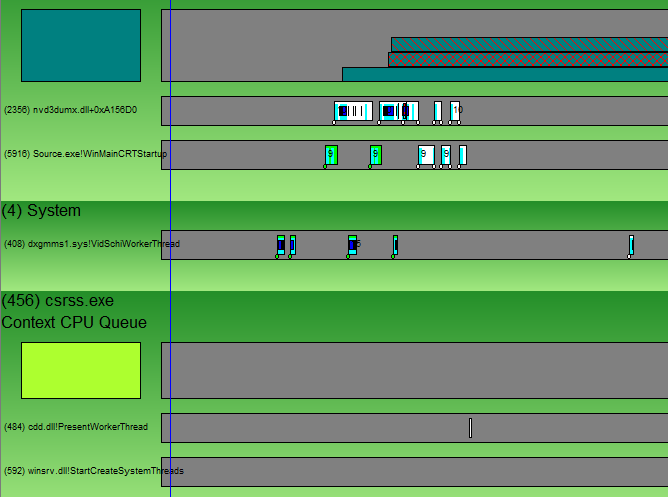
You see that csrss.exe executed something before the video scheduler started to flush the GPU. Unfortunately I can’t tell from this CPU time slice what csrss.exe did. The event trace contains only the stack of when the thread woke up. And that didn’t reveal anything about what csrss.exe was about to do. If I was lucky the sampled stack collector was active at exactly this time point so I’d see the stack trace of csrss.exe in the ‘CPU Usage (Sampled)’ in WPA. But I was not lucky. The information I was looking for was in the next CPU time slice of csrss.exe which also woke up after the next vsync:
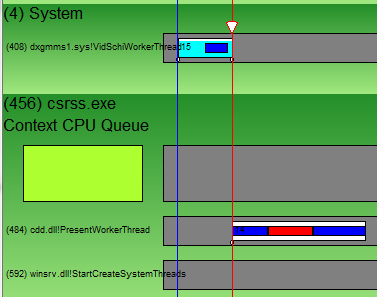
When I clicked the small handle of the csrss.exe CPU time slice GPUView showed me that the System video scheduler thread did ready the csrss.exe thread. The small white triangle indicates this. In other words: the video scheduler did unlock something what the csrss.exe thread was waiting for (to learn more about wait analysis read this great article by Bruce Dawson: Xperf Wait Analysis–Finding Idle Time). The video scheduler did this after the GPU flush completed, so csrss.exe was waiting for the GPU flush. And indeed the stack trace of csrss.exe contains the next hint:
0 0xFFFFF80003686F97 ntoskrnl.exe!SwapContext_PatchXRstor+0x103
1 0xFFFFF80003686A8A ntoskrnl.exe!KiSwapContext+0x7A
2 0xFFFFF800036795F2 ntoskrnl.exe!KiCommitThreadWait+0x1D2
3 0xFFFFF8000368A99F ntoskrnl.exe!KeWaitForSingleObject+0x19F
4 0xFFFFF880043CD132 dxgmms1.sys!VidSchiRequestSchedulerStatus+0x86
5 0xFFFFF880043CE002 dxgmms1.sys!VidSchSuspendAdapter+0x32
6 0xFFFFF880042D09A3 dxgkrnl.sys!DXGADAPTER::SetGammaRamp+0xFF
7 0xFFFFF880042D0EA2 dxgkrnl.sys!DxgkCddSetGammaRamp+0x1BA
8 0xFFFFF960006D5E75 cdd.dll!PresentWorkerThread+0xB09
9 0xFFFFF800039202EA ntoskrnl.exe!PspSystemThreadStartup+0x5A
10 0xFFFFF800036748E6 ntoskrnl.exe!KiStartSystemThread+0x16
SetGammaRamp was the command which required the GPU to complete all the work in the queue (so it won’t be affected by the change probably). But I still don’t know which process told csrss.exe to execute this command. I don’t see no more processes in GPUView. But this doesn’t mean there are no more processes. GPUView does hide some processes which it finds to be not relevant for the trace. I switch to WPA and load the same trace.
SetGammaRamp was a blocking call for csrss.exe. So maybe it did also block the process which called csrss.exe. If it did, I would see the culprit wake up after csrss.exe with its stack trace some where around a ‘gamma ramp’. I use GPUView to determine the time stamps where this all happened. Like the time when the the video scheduler woke up. In WPA I select the ‘CPU Usage (Precise) Timeline by Process’ view. The precise CPU view contains stack traces of the threads when they wake up. Right click in the graph area and choose ‘Select Time Range…’. Then right click ‘Zoom’. The view zooms to the time range. Here’s what I saw:
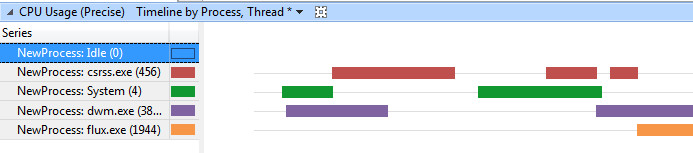
I saw the first slice of the system video scheduler thread (this was right after the vsync event); it readied csrss.exe. csrss.exe did some work and went to sleep for two times. It looks like csrss.exe readied either dmw.exe or flux.exe. I verified this by looking at the ‘ReadyingProcess’ column in the tabular view (you can adjust the visible columns by clicking the cog icon in the graph head line right to the graph name). It looks like csrss.exe did ready both threads:
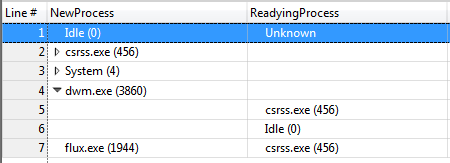
Examining the stack traces (don’t forget to setup symbol path and tell WPA to load symbols (Trace->Load Symbols)) showed that dwm.exe was waiting for shared access to the graphical device to do some frame statistics. Looks harmless. flux.exe on the other hand, had this wake up stack trace:
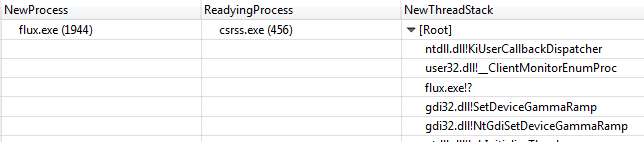
(Note that WPA presents the stack traces the other way round as GPUView. The oldest frame is at the top and the youngest frame is at the bottom. So upper frames invoked lower frames.)
Bulls eye! So flux.exe told the system to set the gamma ramp. f.lux is a small back ground tool which adjusts the color temperature of your screen according to sun rise and sun set times. This shows very nicely that one has to consider everything when analyzing problems. Even though f.lux consumed no CPU and no GPU time it was responsible for the frame skip.
-
Assuming the symbol path was set up correctly (Options > Symbol Path…). You can set the symbol path to something similar to this:
srv*C:\Symbols*http://msdl.microsoft.com/download/symbols;and enable ‘Use Symbol Server’. ↩
Comments